VWAnalyzer
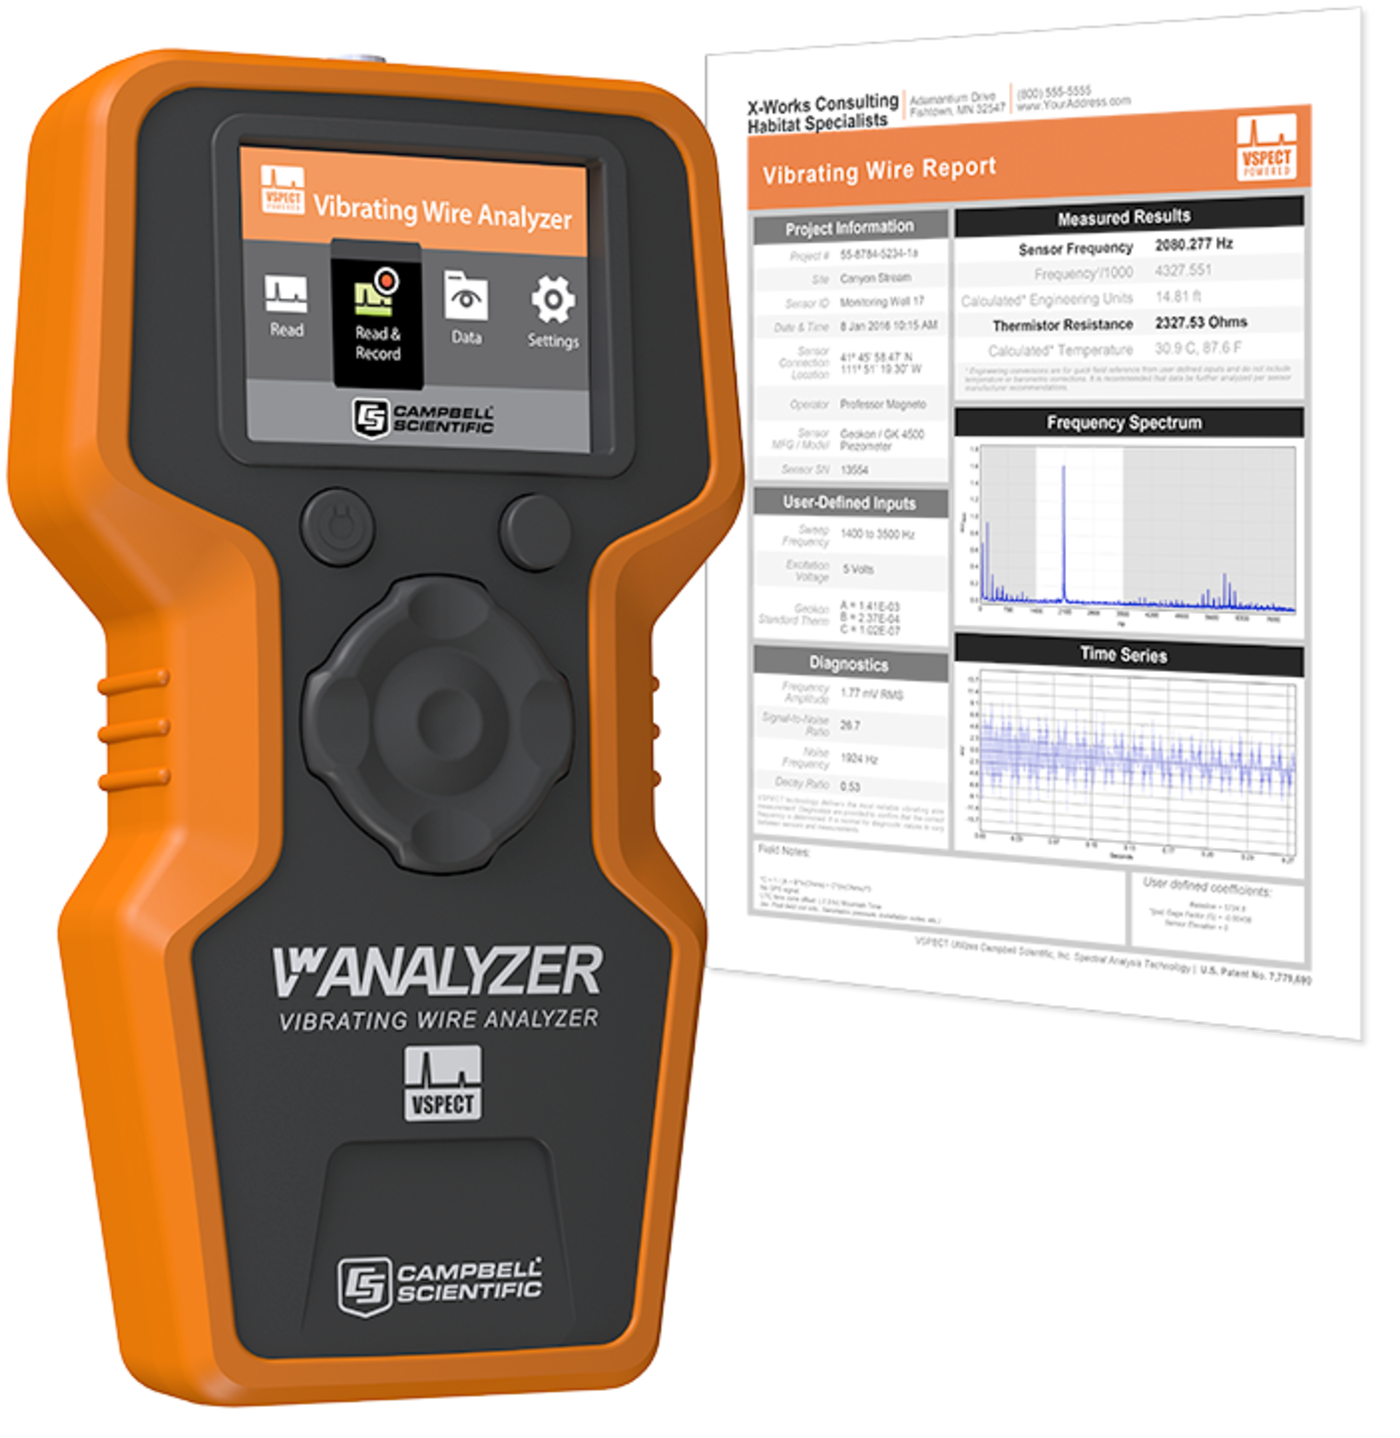
VWAnalyzer
OrderableConfigurableVibrating Wire Analyzer
The ultimate vibrating-wire field reader for installations, system maintenance, and manual measurements.
Pricing
- Model:
- VWAnalyzer
- Item Number:
- 44238
- Warranty:
- 1 year
- Lead time:
- 14 days
Overview
The Vibrating Wire Analyzer (VWAnalyzer) is the most innovative vibrating wire field reader available. The VWAnalyzer is field ready to quickly measure your sensor, save your data, and communicate the results with custom PDF reports and spreadsheet output. VWAnalyzer measurements are geolocated with an integrated GPS, allowing the device to verify locations and direct you to your sensors. The VWAnalyzer uses spectral-analysis technology (VSPECT™) to provide the best vibrating wire measurement possible while filtering out environmental and electrical noise. The large color display offers you an easy-to-view graphical presentation of the data.
Learn about our patented VSPECT spectral-analysis technology at our VSPECT Essentials web resource.
The dynamic vibrating wire measurement technique is protected under U.S. Patent No. 8,671,758, and the vibrating wire spectral analysis technology (VSPECT) is protected under U.S. Patent No. 7,779,690.
Key Advantages
For installations, system maintenance, and manual measurements
Technical Description
The Vibrating Wire Analyzer (VWAnalyzer) uses patented VSPECT technology for the most reliable vibrating wire measurements available. The VWAnalyzer converts measurements to engineering units, generates a printable PDF report, and saves a CSV summary file. The graphical display allows confirmation of sensor output and operation. VSPECT technology eliminates disruptive noise interference and provides sensor diagnostics for the best measurement possible. VSPECT noise immunity allows gauges that are otherwise unreadable to be evaluated with confidence.
A project file maintains site/sensor information for 40 unique sites with 22 sensors per site. Site/sensor locations are geolocated, allowing the internal GPS to guide a user directly to a sensor location. Site/sensor and user information can be created or edited on the device or with a computer using the free VwProjects software.
Note: The VWAnalyzer can be connected to a computer and is treated like an external memory device (flash memory drive) to transfer data.
What is a VSPECT measurement?
VSPECT provides the best vibrating wire measurement available. A sensor frequency is easily identified while filtering out environmental and electrical noise that affects the quality of other vibrating wire readers. VSPECT provides measurement diagnostics to understand sensor response, installation quality, and identify incorrect wiring or damaged sensors.
Output and Diagnostics
Sensor Frequency (Hz)
Frequency is a measured value.
Basic measurement from a vibrating wire sensor. The frequency can be converted into engineering units (for example: pressure, displacement) and is the largest measured amplitude signal within the frequency sweep.
Sensor Amplitude (mV RMS)
Diagnostic values describe the quality of the frequency measurement.
Signal strength from the vibrating wire sensor. Amplitude varies and is affected by the sensor type, excitation strength (adjustable), and sensor cable length.
Signal-to-Noise Ratio (unitless)
Diagnostic values describe the quality of the frequency measurement.
Sensor signal amplitude divided by the largest noise amplitude within the sweep frequency. A low signal-to-noise ratio indicates a weak sensor signal or a noisy environment.
Noise Frequency (Hz)
Diagnostic values describe the quality of the frequency measurement.
Largest amplitude noise signal within the frequency sweep.
Decay Ratio
Diagnostic values describe the quality of the frequency measurement.
Signal attenuation (how quickly the signal strength decreases).
Thermistor/RTD Resistance (Ω)
Resistance is a measured value.
Measurement used to calculate sensor temperature and correct for thermal effects. The VWAnalyzer measures the vibrating wire sensor temperature (when present); thermal and barometric corrections require post processing.
Benefits
- Custom PDF reports
- Measurement confidence with graphical display and VSPECT technology
- Full-color screen and easy-to-use menus
- Integrated GPS to record sensor location
- Ability to read any vibrating wire sensor
- Sensor library containing common vibrating wire sensors
- Quick transfer of PDF and CSV files with a USB connection
Specifications
- Memory
- NOTE:
Non-volatile memory stores data, reports, and project files. When memory is full, new data overwrite the oldest data. Users need to delete/transfer files when memory is full.
- Memory
- 1,700 site/sensor measurements
(most recent)
- Memory
- 40 unique sites, 22 sensors per site
- Memory
- 240 single measurements
(most recent)
- Memory
- 16,500 continuous measurements
(most recent)
- Memory
- 80 MB USB memory
(PDF, CSV, VWA, and other files)
- GPS
- ±5 m (16.4 ft) typical
(±1 ms time sync)
- Channel Count
- 1 channel
(vibrating wire and thermistor reading)
- Enclosure
- IP62
- Battery Type/Life
- 5 AA (1.5 V)
20 hours continuous use - Operating Temperature Range
- -20° to +70°C
- Compliance
- CE, RoHS
- USB Mini B
- Direct connect to PC
(supplies power to retrieve data)
- Warranty
- One year against defects in materials and workmanship
- Dimensions
- 200 x 100 x 58 mm
(7.9 x 3.9 x 2.3 in.)
- Weight
- 0.34 kg
(0.75 lb)
Measurements - Vibrating Wire
- Vibrating Wire Frequency Range
- 300 to 6500 Hz
- Resolution
- 0.001 Hz RMS
- Accuracy
- ±0.005% of reading
- Excitation
- 2 V, 5 V, 12 V
(user-selectable)
- Method
- VSPECT - U.S. Patent No. 7,779,690
- Measurement Interval Range
- 1 s to 15 min
(continuous reading mode only)
- Speed
- 1 s
(fastest)
Measurements - Thermistor
- Resolution
- 0.01 Ω RMS
- Accuracy
- ±0.15% of reading

Related Resources
Case Studies
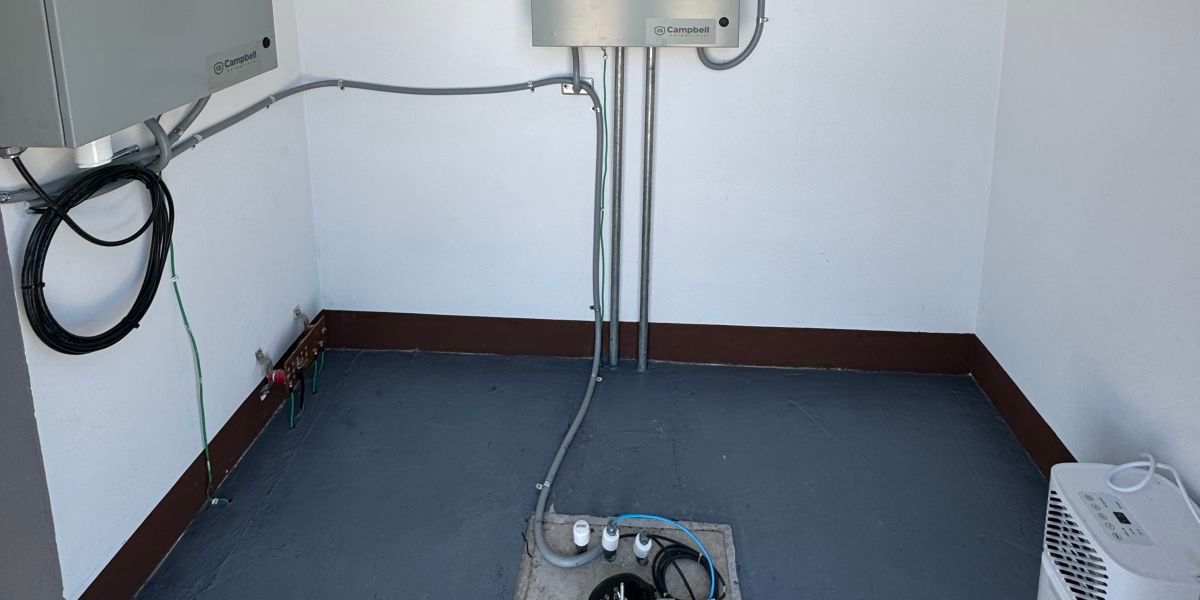
Nicaragua: Dams Entering the Modern Era of Safety Monitoring
Hydroelectric power monitoring
Nicaragua
April 13, 2026
View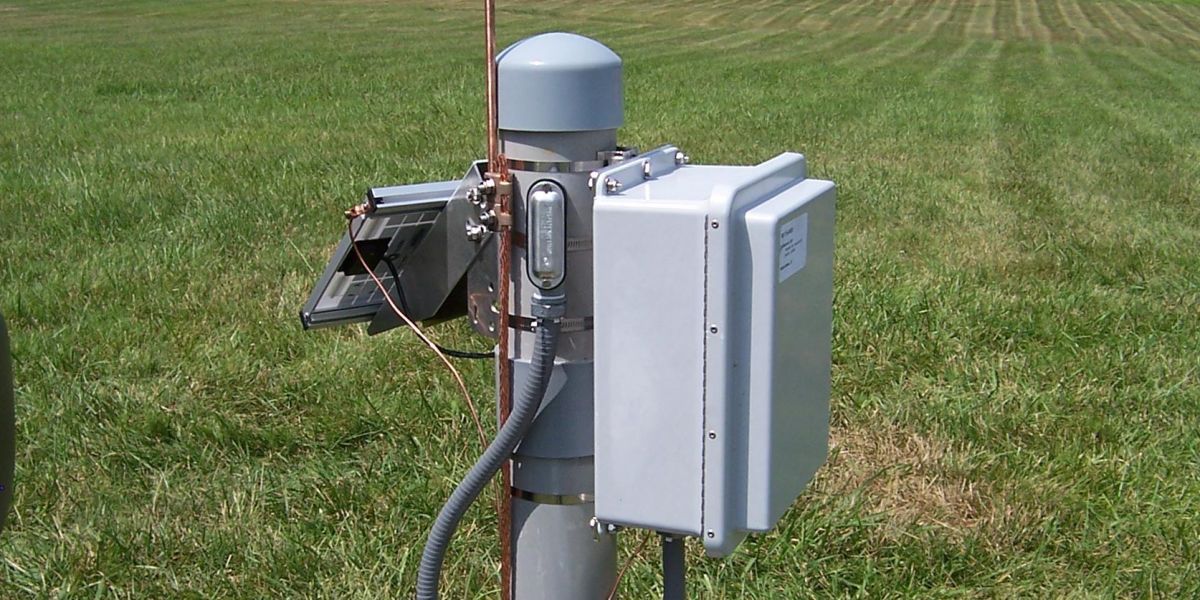
Kentucky: Dam Repair
Monitoring reservoir seepage during dam repair
Kentucky
November 23, 2009
View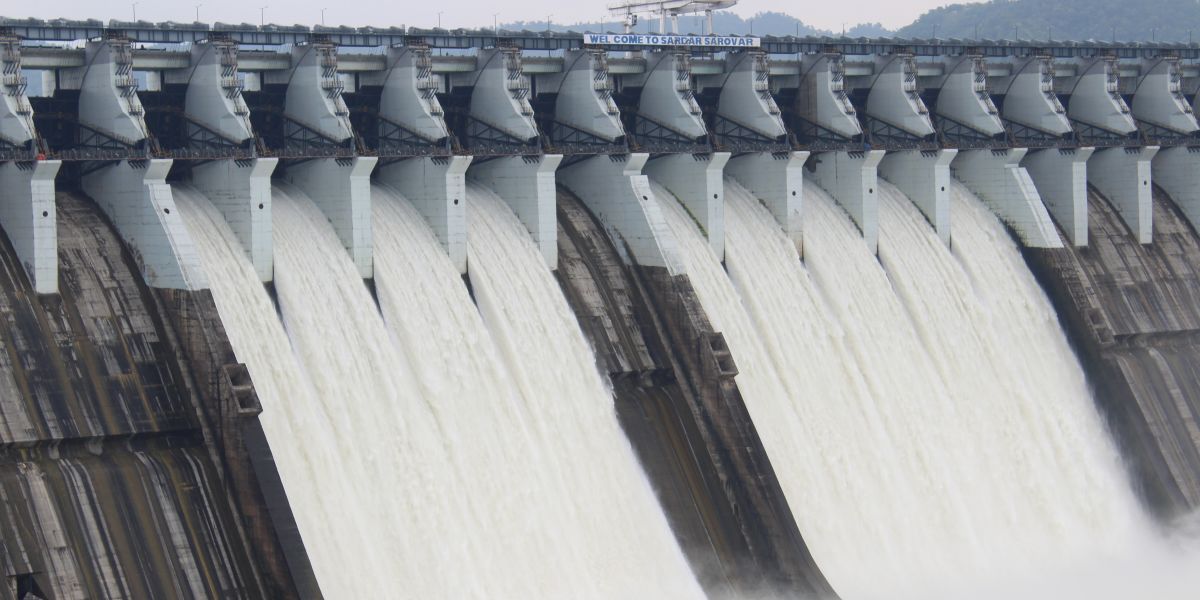
Southwest: Solving the Mystery of Erroneous Dam Monitoring Data
Improving vibrating wire measurement reliability
Southwest, USA
December 5, 2023
View
Documents
Videos and Tutorials
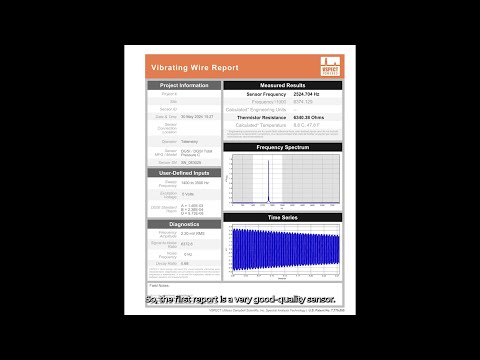
Reading VSPECT™ Reports
June 25, 2025 (21:33)
Real-world examples to help you diagnose sensor health and data quality
Watch
Webinar | VSPECT™—Patented Spectral-Analysis Technology
May 28, 2021 (48:50)
Spectral analysis of vibrating wire sensors for accuracy, confidence, and trust
Watch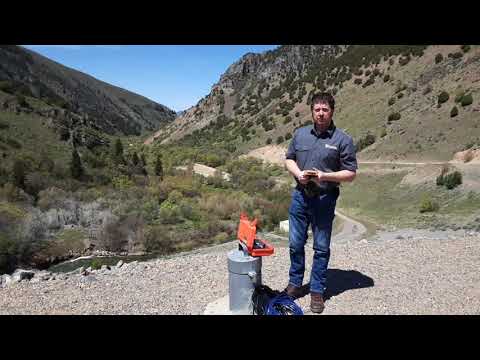
Benefits of the VWAnalyzer
July 16, 2020 (3:37)
Learn about the most innovative vibrating wire field reader available
Watch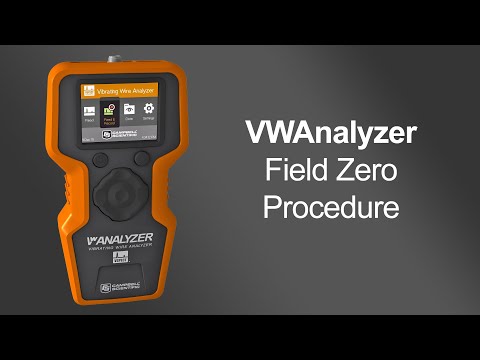
Using the VWAnalyzer to Perform a Field Zero Measurement
September 17, 2020 (3:23)
An explanation of the VWAnalyzer field zero procedure
Watch- View all videos and tutorials