
Have you ever set up a Campbell Scientific data logger as a Modbus server and discovered that your data was not arriving at your SCADA system as you expected? You may have quickly realized two things: troubleshooting the communication problem is not an easy task, and there are many different approaches you can take. In this article, I’ll quickly share with you one method that I have found to be both helpful and a time-saver.
Campbell Scientific data loggers provide measurement data to SCADA (supervisory control and data acquisition) systems throughout the world. This is often accomplished by configuring the data logger as a Modbus TCP/IP server, which we discussed in the “How to Access Live Measurement Data Using Modbus” blog article.
Normally, the process of setting up the communication between your data logger and SCADA system is smooth, but there are occasions when technicians in the field discover that the data is not arriving at the SCADA system as expected. At times like this, you may wonder: Where is the problem with the communication? Is the problem at the SCADA system (Modbus client), the data logger (Modbus server), or somewhere in-between?
In our last Modbus blog article, we used an example with a data logger that was set up to make analog measurements and provide the data to the SCADA system through the Modbus TCP/IP protocol.
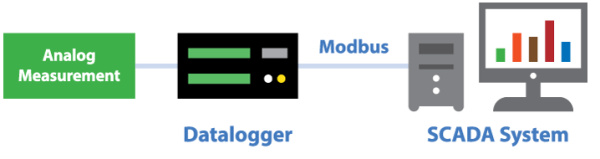
We will use that same example here. Your SCADA system is set up to poll your data logger every second for the contents of its Modbus registers. Your data logger, in turn, makes analog measurements and then stores them in its Modbus Holding and Input registers every second.
But what if your SCADA system does not successfully receive data from your data logger? What can you do now? You can use Campbell Scientific’s Device Configuration Utility (DevConfig) to monitor the incoming traffic to your data logger. This helps determine if the polls from your SCADA system are arriving at your data logger, and if your data logger is responding.
Follow these steps to use DevConfig to see the Modbus polls:
- Open the Device Configuration Utility, and connect to your data logger.
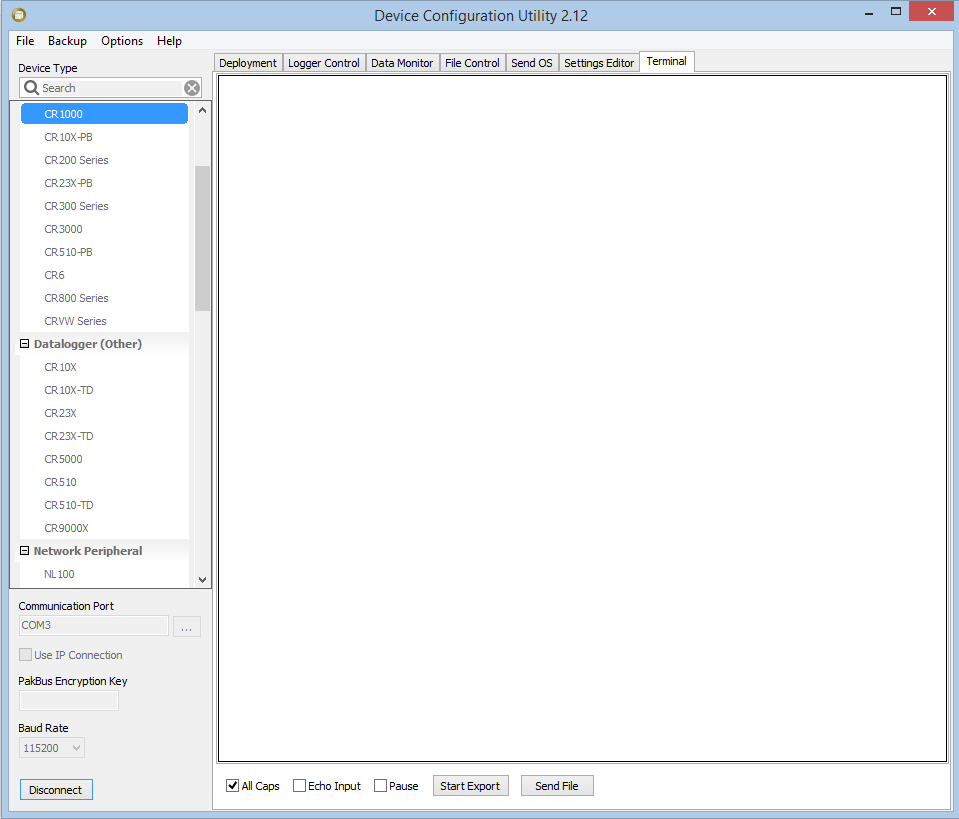
- Select the Terminal tab on the far right.
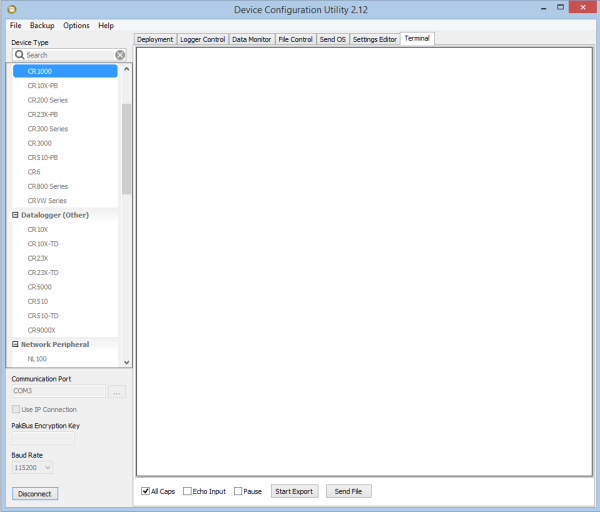
Click the DevConfig screen for a larger image.
- Press the Enter key on your keyboard until you see a prompt on your screen.
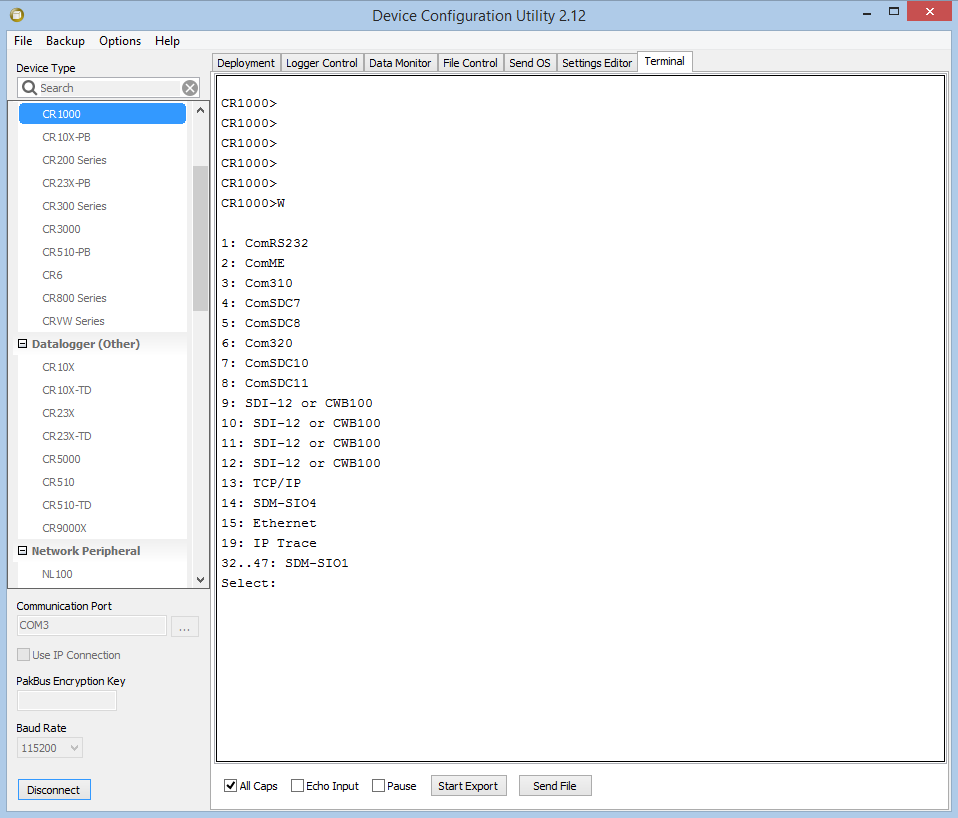
- Type W, and press the Enter key.
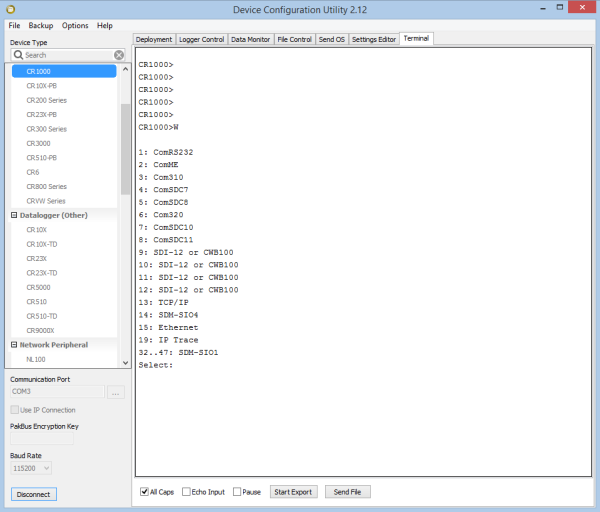
Click the DevConfig screen for a larger image.
- To select TCP/IP, type 13 and press the Enter key.
- On your screen, you will be asked ASCII (Y)? Type N, and press the Enter key.
- If your data logger is not receiving any Modbus polls, your screen will likely look something like this:
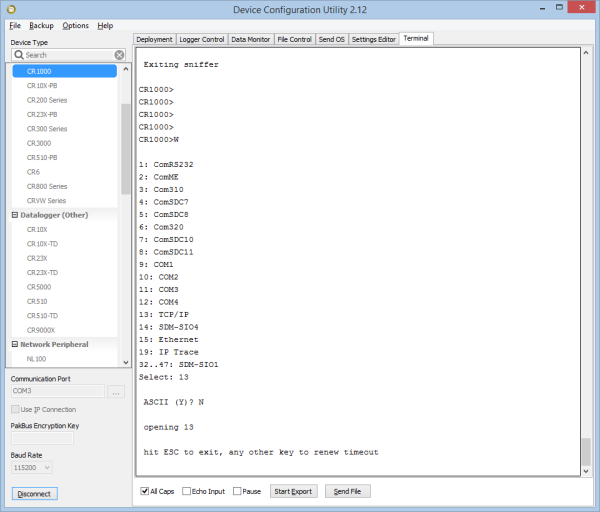
Click the DevConfig screen for a larger image.
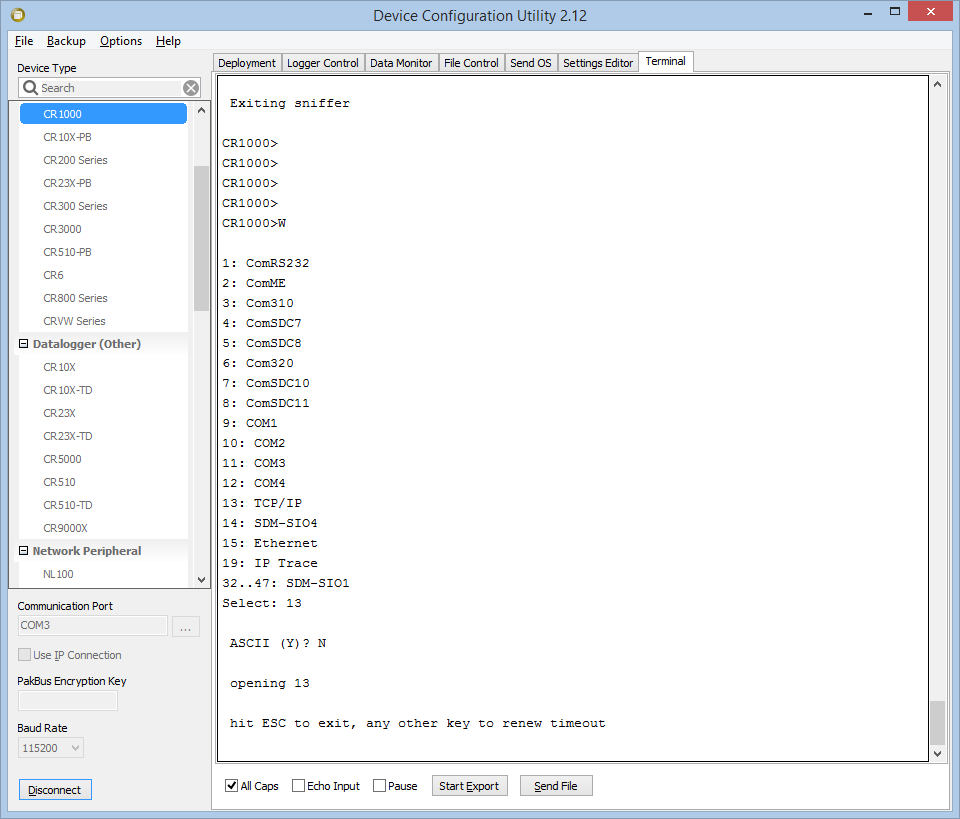
Note that there is no Modbus traffic being detected over TCP/IP. The only message on the screen is “hit ESC to exit, any other key to renew timeout.” This scenario could indicate one or more of the following conditions:
- The SCADA system is not polling the data logger.
- The SCADA system is polling a different IP address.
- The data logger has been assigned an incorrect IP address.
- A cable is not plugged in.
- Modbus traffic is being blocked by the network.
Your data logger may be set up and programmed completely fine, but if it is not receiving the polls from the SCADA client, the data will not arrive where it is expected. At this point, focus your troubleshooting efforts on the SCADA network, client configuration, etc. (areas outside of the data logger).
Special Note: In instances like this, you may see traffic over TCP/IP that is not Modbus traffic, such as PakBus™ traffic from a LoggerNet Server if there is a LoggerNet-to-data-logger connection on the network.
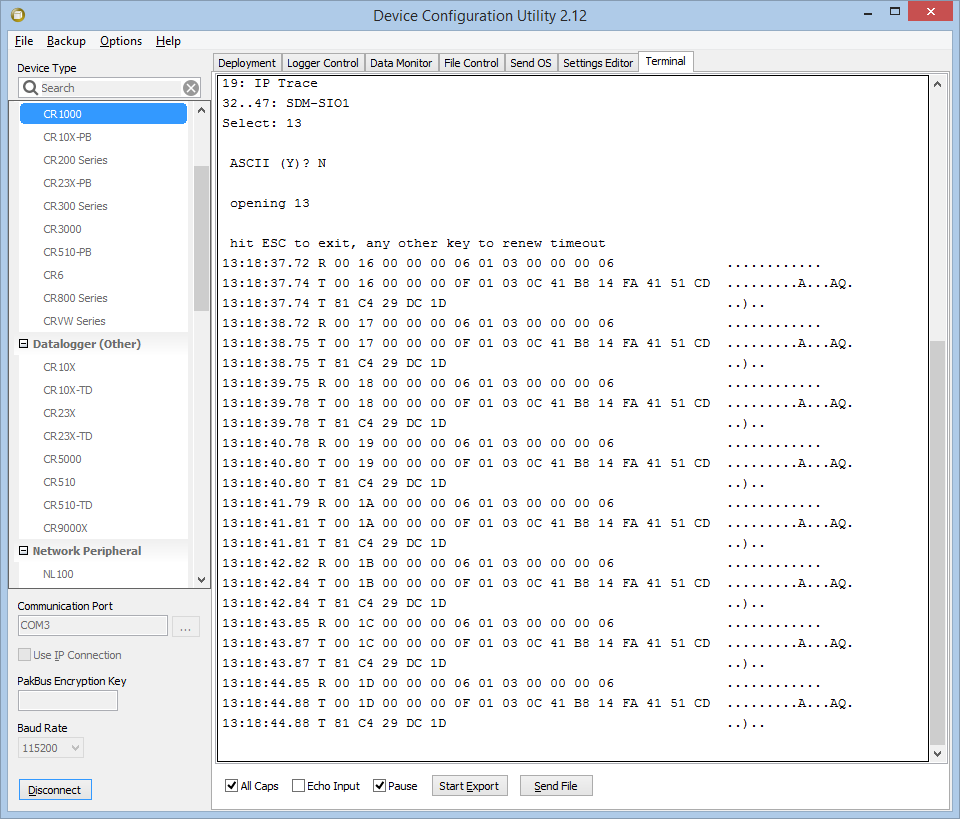
After you’ve addressed your network or SCADA system problems, a successful trace looks like this:
Click the DevConfig screen for a larger image.
The easiest way to recognize the Modbus TCP traffic and distinguish it from other protocols is that the transmission from the client always starts with an identifier in the first two bytes. In our example, the first poll that was recognized in the trace started with 00 16. The data logger, in turn, responded with this same unique identifier (00 16). The next time the client polled, it used an identifier of 00 17, and the data logger responded with 00 17.
Special Note: There is a difference between Modbus TCP traffic and Modbus RTU traffic. The easiest way to recognize Modbus RTU traffic is to look for a transmission from the client that starts with the Modbus server address and function code. The server response will also start with its address and function code.
If you can see Modbus polls coming from the client (T), but no responses from the data logger (R), it is time to check the configuration and programming of the data logger. You may have an error in your setup such as:
- The data logger is not programmed as a Modbus server.
- The data logger has been given a Modbus server ID that does not match what the client is polling.
At this point, you’ll need to dig into your data logger setup for further troubleshooting.
Conclusion
Using DevConfig to watch the TCP/IP traffic on your data logger is a great way you can quickly check to see if things are working as expected. This method often saves a lot of time because you can more quickly identify the communication problem.
If you have any questions about this troubleshooting method, please post them below.
Related Articles
Solar Energy in India and the Importance of Pyranometer Calibration
November 6, 2017
Intelligent Road Weather Information Systems (RWIS) on Canadian Winter Roads
June 1, 2017
Using Loops in CRBasic to Prevent Unnecessary Skipped Scans
Learn how to avoid having false skipped scans.
May 31, 2017
Using Loops in CRBasic to Prevent Unnecessary Skipped Scans
Learn how to avoid having false skipped scans.
May 31, 2017