KonectGDS
KonectGDS
Limited availabilityKonect Global Data Services
Overview
Konect Data Services from Campbell Scientific are designed with security from the datalogger all the way to your browser. Built around the latest technologies, we can collect, archive, present and relay your data in a variety of ways, all the time ensuring your data remains safe, secure but highly accessible when you need it.
View a Konect GDS demo site for Nibley, Utah.
For more information, visit the Konect GDS website.
| DASHBOARDS |  |
SAFE, SECURE, RELIABLE | |
SCHEDULED REPORTS |
|---|---|---|---|---|
 |
 |
 |
||
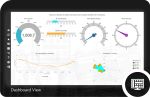
| Use the new Konect View Studio to design your own live updating dashboards. |
We take our role as custodian of your data seriously. Security is key with Konect. |
Use scheduled reports to relay your data elsewhere on your behalf. |
||
| PAKBUS ROUTING | KIOSK MODE | DEVICES | ||
 |
 |
 |
||
|
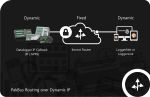
Dynamic IP is easily supported with a PakBus Router. See the Konect PakBus Router page. |
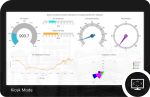
Use Kiosk Mode to share your dashboards with others or produce live updating displays. | Konect supports a wide range of Campbell Scientific devices, and the list keeps growing. | ||
| QUERIES & EXPORTS | ALERTS, QC AND NOTIFICATIONS | WIDGETS | ||
 |
 |
 |
||
|
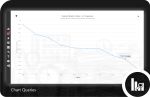
Use table and chart queries to search, display, and export from your data archive. |
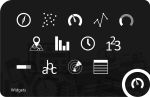
Konect can keep you informed through integrated notifications. | Choose from an expanding set of widgets to display your data in powerful ways. |
Key Advantages
Technical Description
Konect Global Data Services is a cloud-based application for collection and display of data from Campbell Scientific's IP-enabled data loggers. It's built on a solid foundation of Campbell Scientific technology and hosted in a Microsoft Azure environment, so you can rest assured that your collected data is secure and available when and where you need it.
Data displays are created by selecting from a list of available components and dropping them on a workspace. Components include a variety of gauges (needle, linear, radial, compass), charts (line, xy scatter, columnar, wind rose), and data elements (data tables, data values). The location of stations can be marked on a map, and important data quickly displayed with a single-click on the station's map marker. The displays employ responsive design technology, which means they resize automatically to look great on any size device.
Users of your Konect data display log in under their own username and password, with Admin users having full rights to all functionality in the system. Konect also allows the designation of a data display as a kiosk, so that no user login is required to view the data.
Custom queries can be run on a table in the data logger and displayed in a table or chart format. The data from these queries can be exported to a CSV or Excel format. If you need a more automated solution, schedule one or more reports to run and deliver the data directly to you via email or FTP.
Service Agreement Data Use Limits
As outlined in the Service Level Agreement (SLA) for Konect Global Data Services, which the customer must accept when subscribing to this service, the following are the data use limits (unless amended by a superseding subscription definition):
- Data collection up to 100 data-points per minute (1 data-point is one table field from a datalogger, for string fields every 4 characters is counted as 1 data-point).
- A maximum of 10MB (Megabytes) of data ingress per month (defined as 31-days from the 1st of the month).
- A maximum of 500MB (Megabytes) of data egress per month (defined as 31-days from the 1st of the month), including; but not limited to views, queries, scheduled reports and kiosk mode dashboards, across all users (passports).
Benefits
- Data collected and archived simply, safely, and securely
- Data accessed from any Internet-enabled device with a suitable browser
- Easy to configure
- Drag-and-drop components make data displays easy to configure
- Provides quality control rules, alerts, integrating messaging, tabular views, chart views, map views, status information
- With <a href="https://www.campbellsci.com/pbrouter">Konect PakBus™ Router</a> as a stand-alone service, simply bypass dynamic IP issues and make dynamic mobile/cellular data communication easier
- Image and dynamic image widget allows display of an uploaded or linked-to image
Related Resources
Case Studies
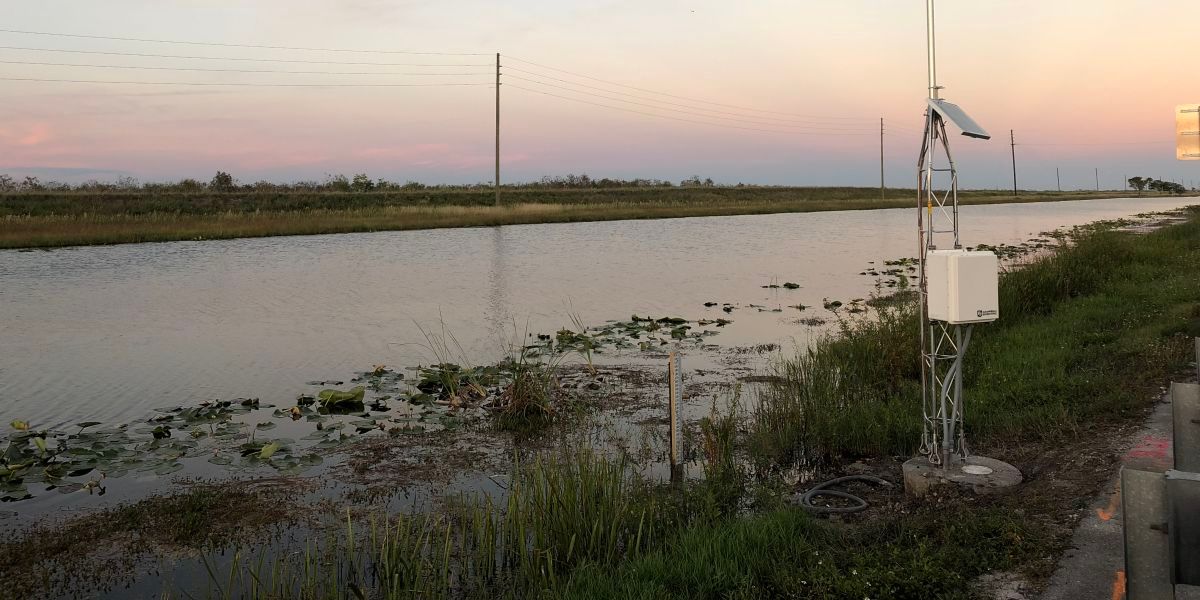
Florida: Road-Base Monitoring
Monitor soil moisture and canal water level to protect highway
Miami, FL
May 20, 2020
View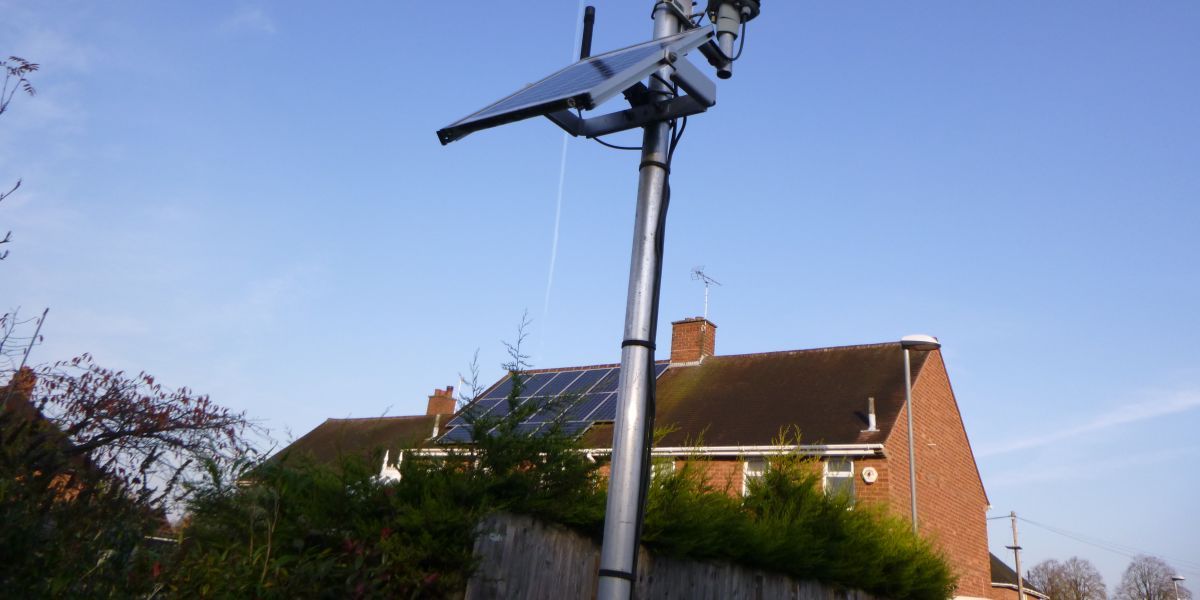
United Kingdom: Observing Urban Climate
Monitoring for early warnings and education
Birmingham, United Kingdom
August 13, 2021
View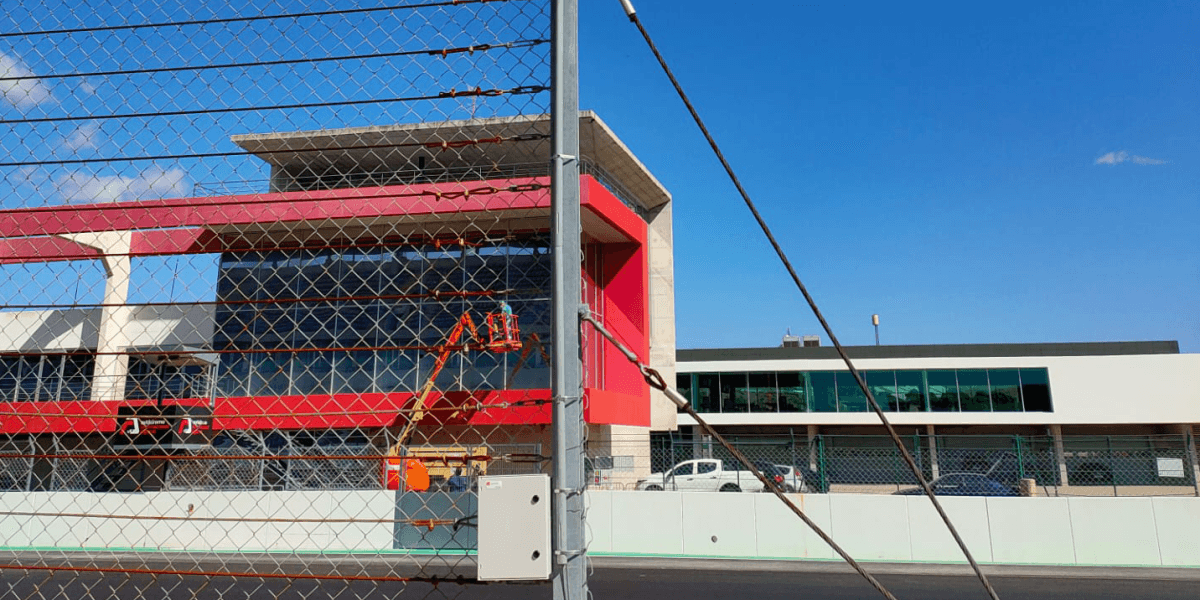
Portugal: Formula 1 Weather Monitoring
Weather and road condition reporting for nowcasting and forecasting
Portimão, Portugal
April 3, 2023
View
Videos and Tutorials
Creating a Konect Dashboard
April 27, 2017 (3:39)
Create a live dashboard to display your data
Watch
Creating a Konect Table Query
May 24, 2017 (1:58)
Present your data in a tabular format
Watch
Configuring Konect to Collect Data
April 26, 2017 (3:35)
Collect data from a datalogger with a fixed IP address
Watch
Customizing the Konect Home Page
May 26, 2017 (0:53)
Use a dashboard view for your home view
Watch- View all videos and tutorials